Learn how to navigate the Reservation Processing page, understand what each data point means, and use built-in tools to monitor and manage automation. Whether you're tracking performance or troubleshooting issues, this page gives you the insights you need to stay in control.
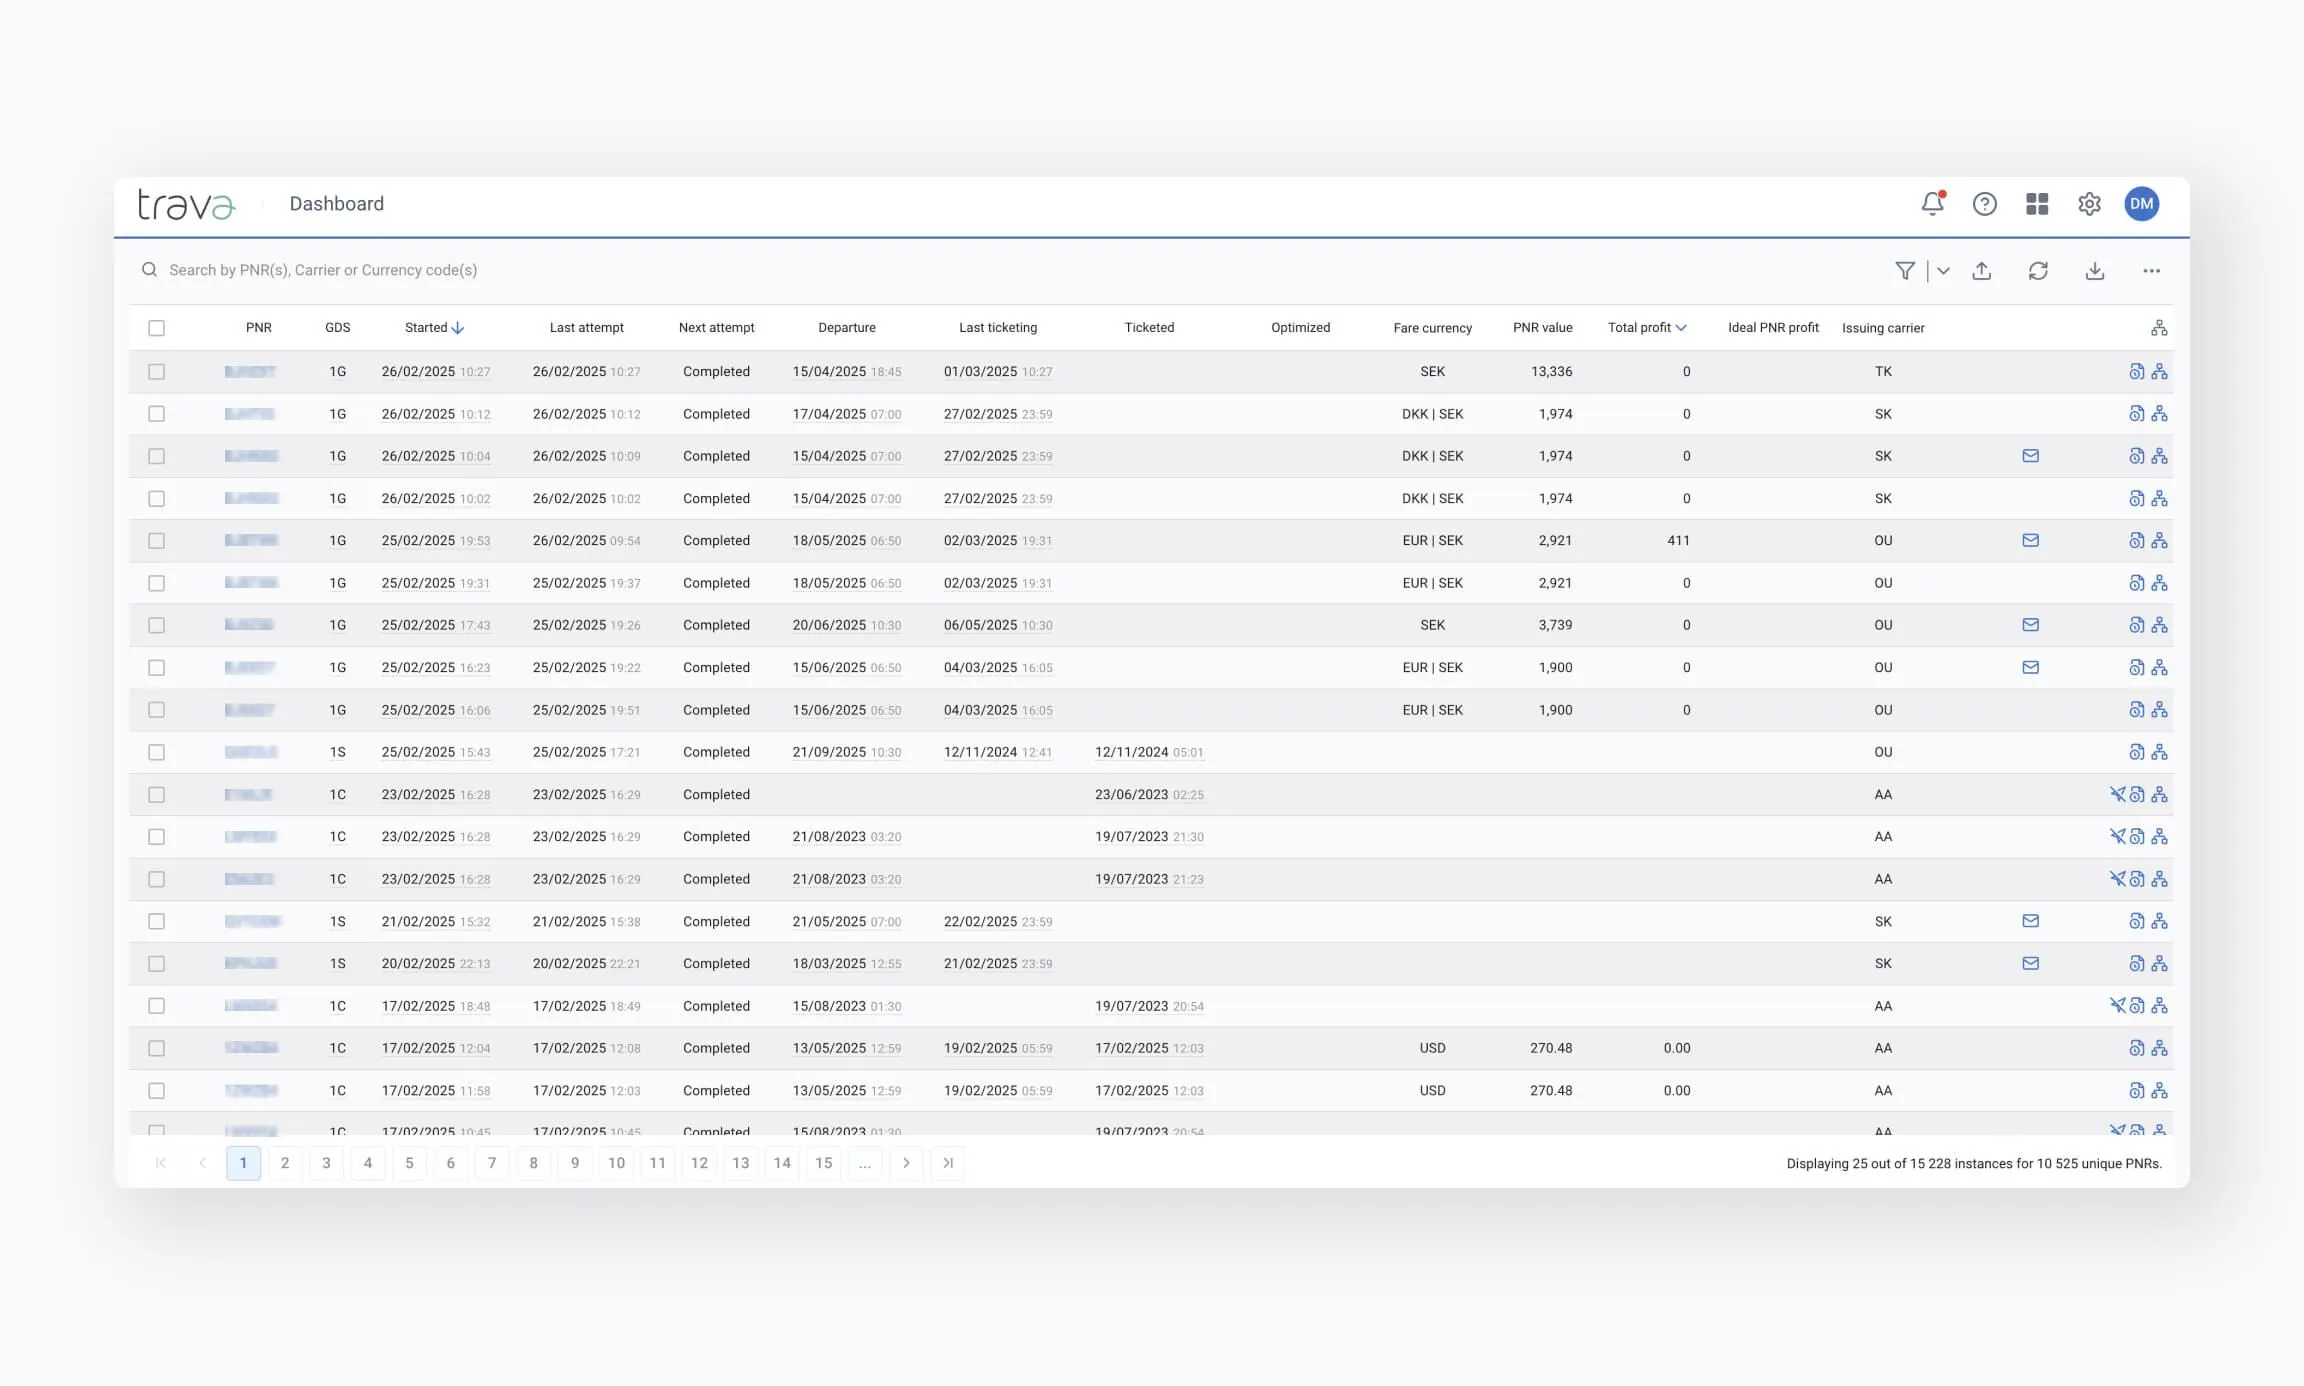
Reservation Processing offers a real-time snapshot of how all the PNRs are being handled across all schemes.
It's especially useful for identifying:
- Processing delays
- Unusual behavior, such as mass failures or scheme errors
- Opportunities for optimization based on fare comparison and profitability data
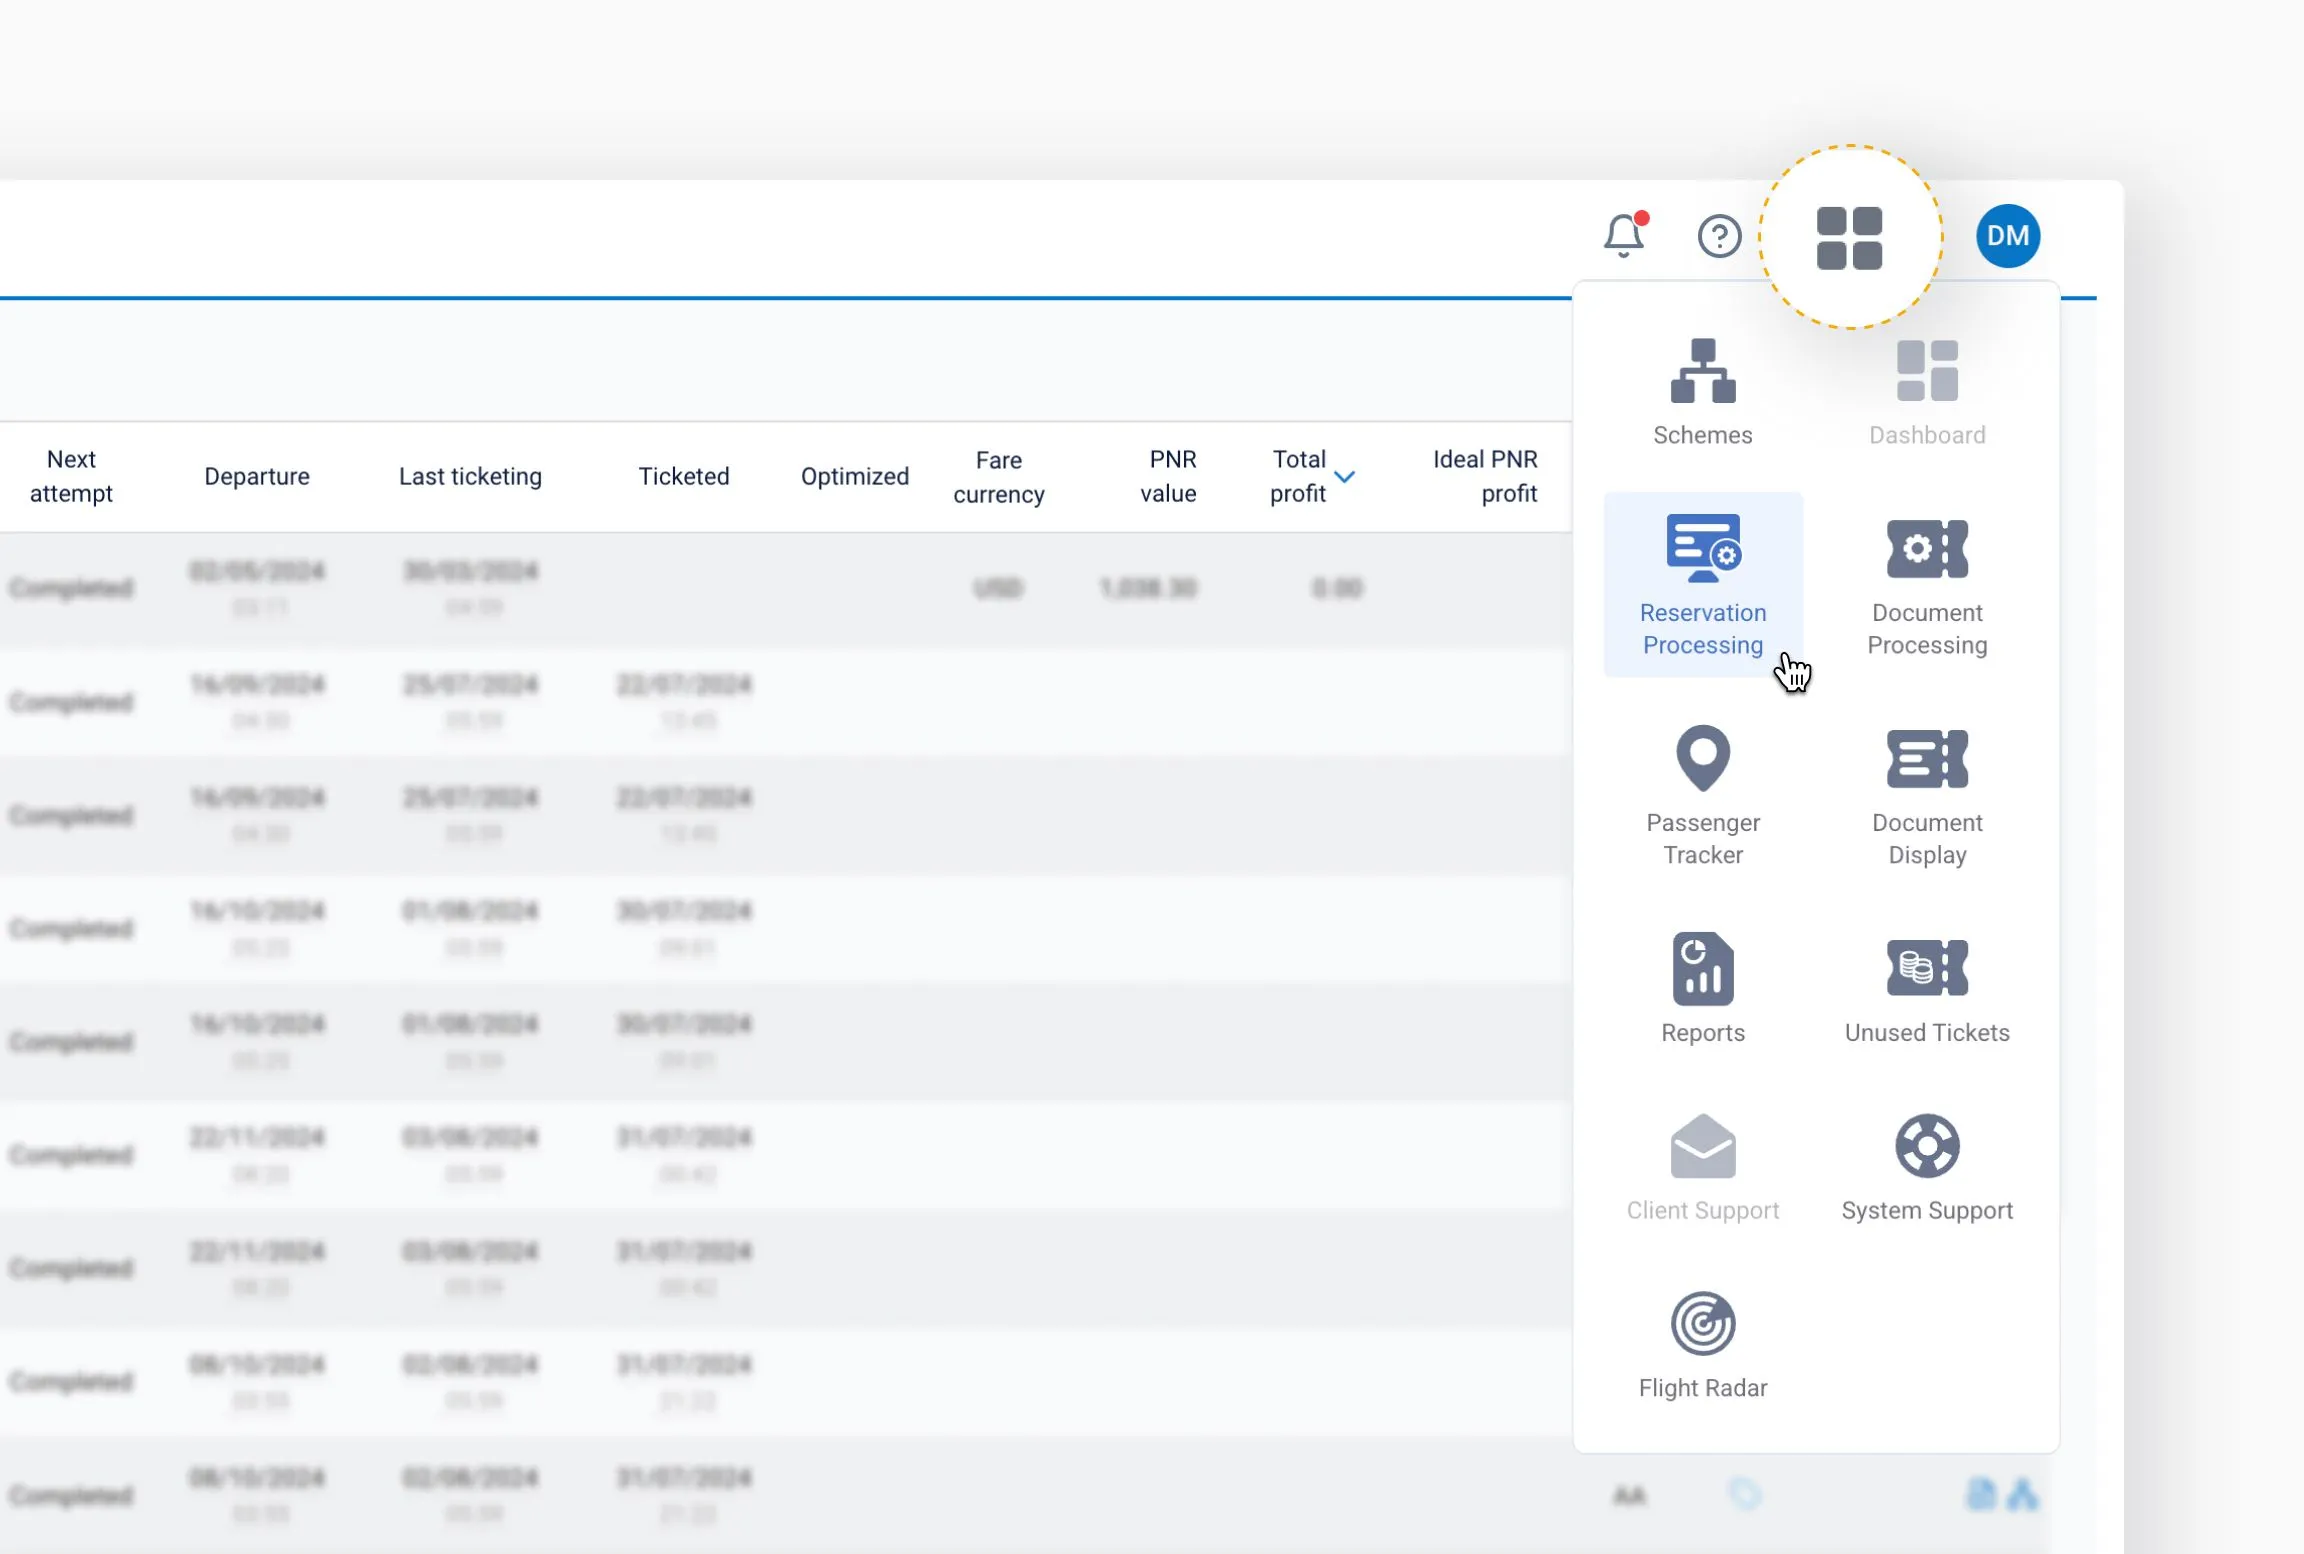
To open the list of all processed PNRs, press Reservation Processing in the main menu.
At the bottom of the page, you'll find a summary with the total number of PNRs and the corresponding number of instances currently displayed.
The Reservation Processing page consists of the following elements:
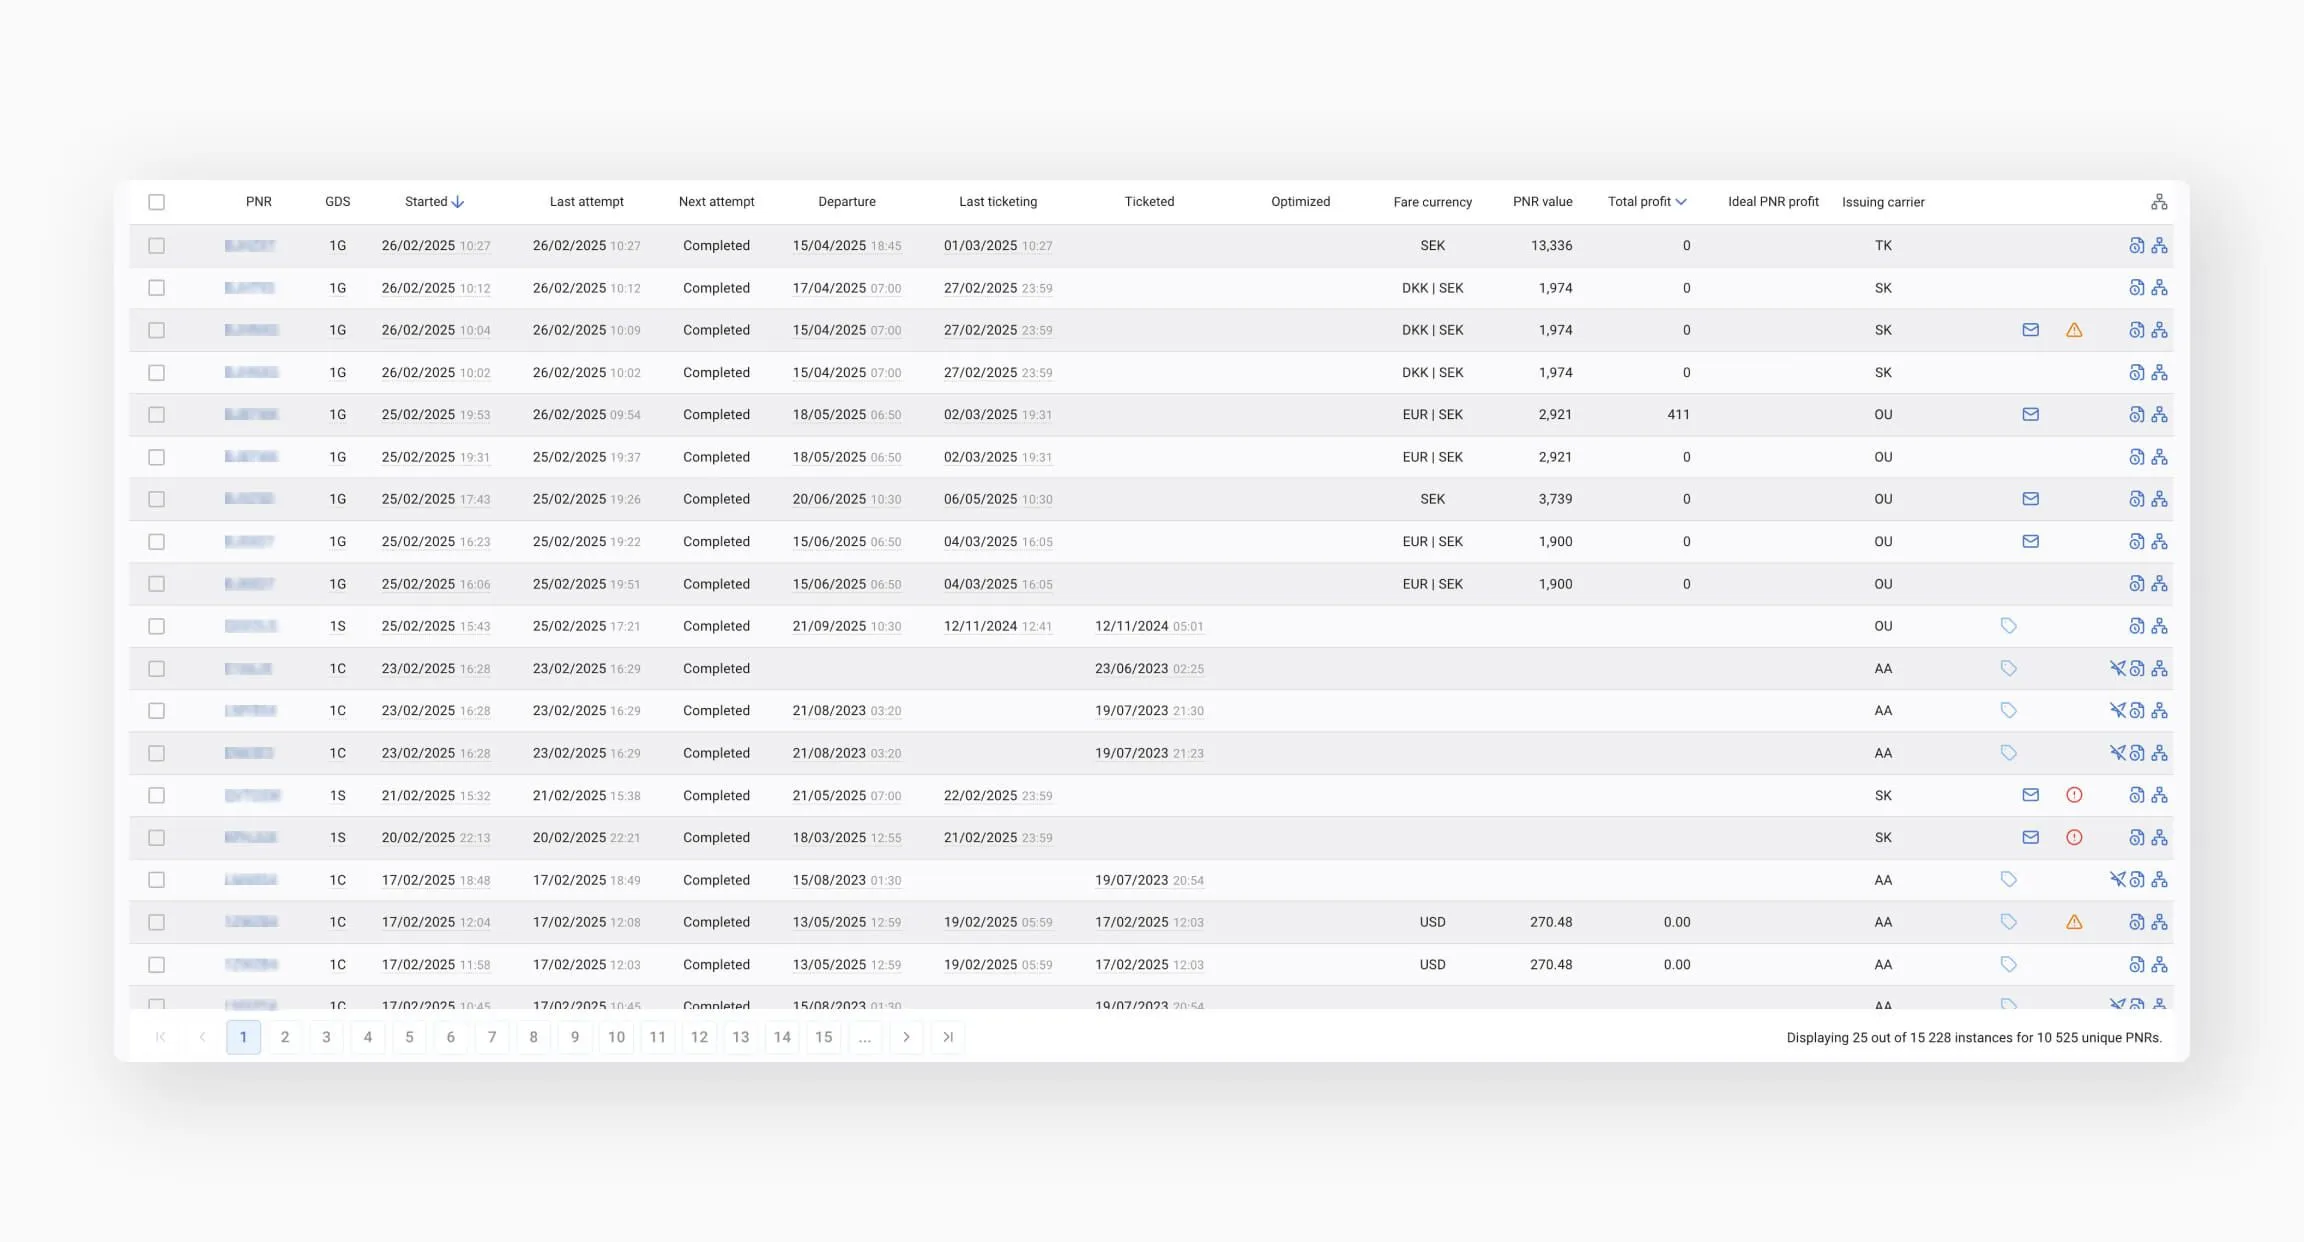
In this section, you'll see the table of all instances. Besides, you'll get to know what information is displayed for each instance, how data appears for optimized PNRs, and what the icons at the end of each instance row mean.
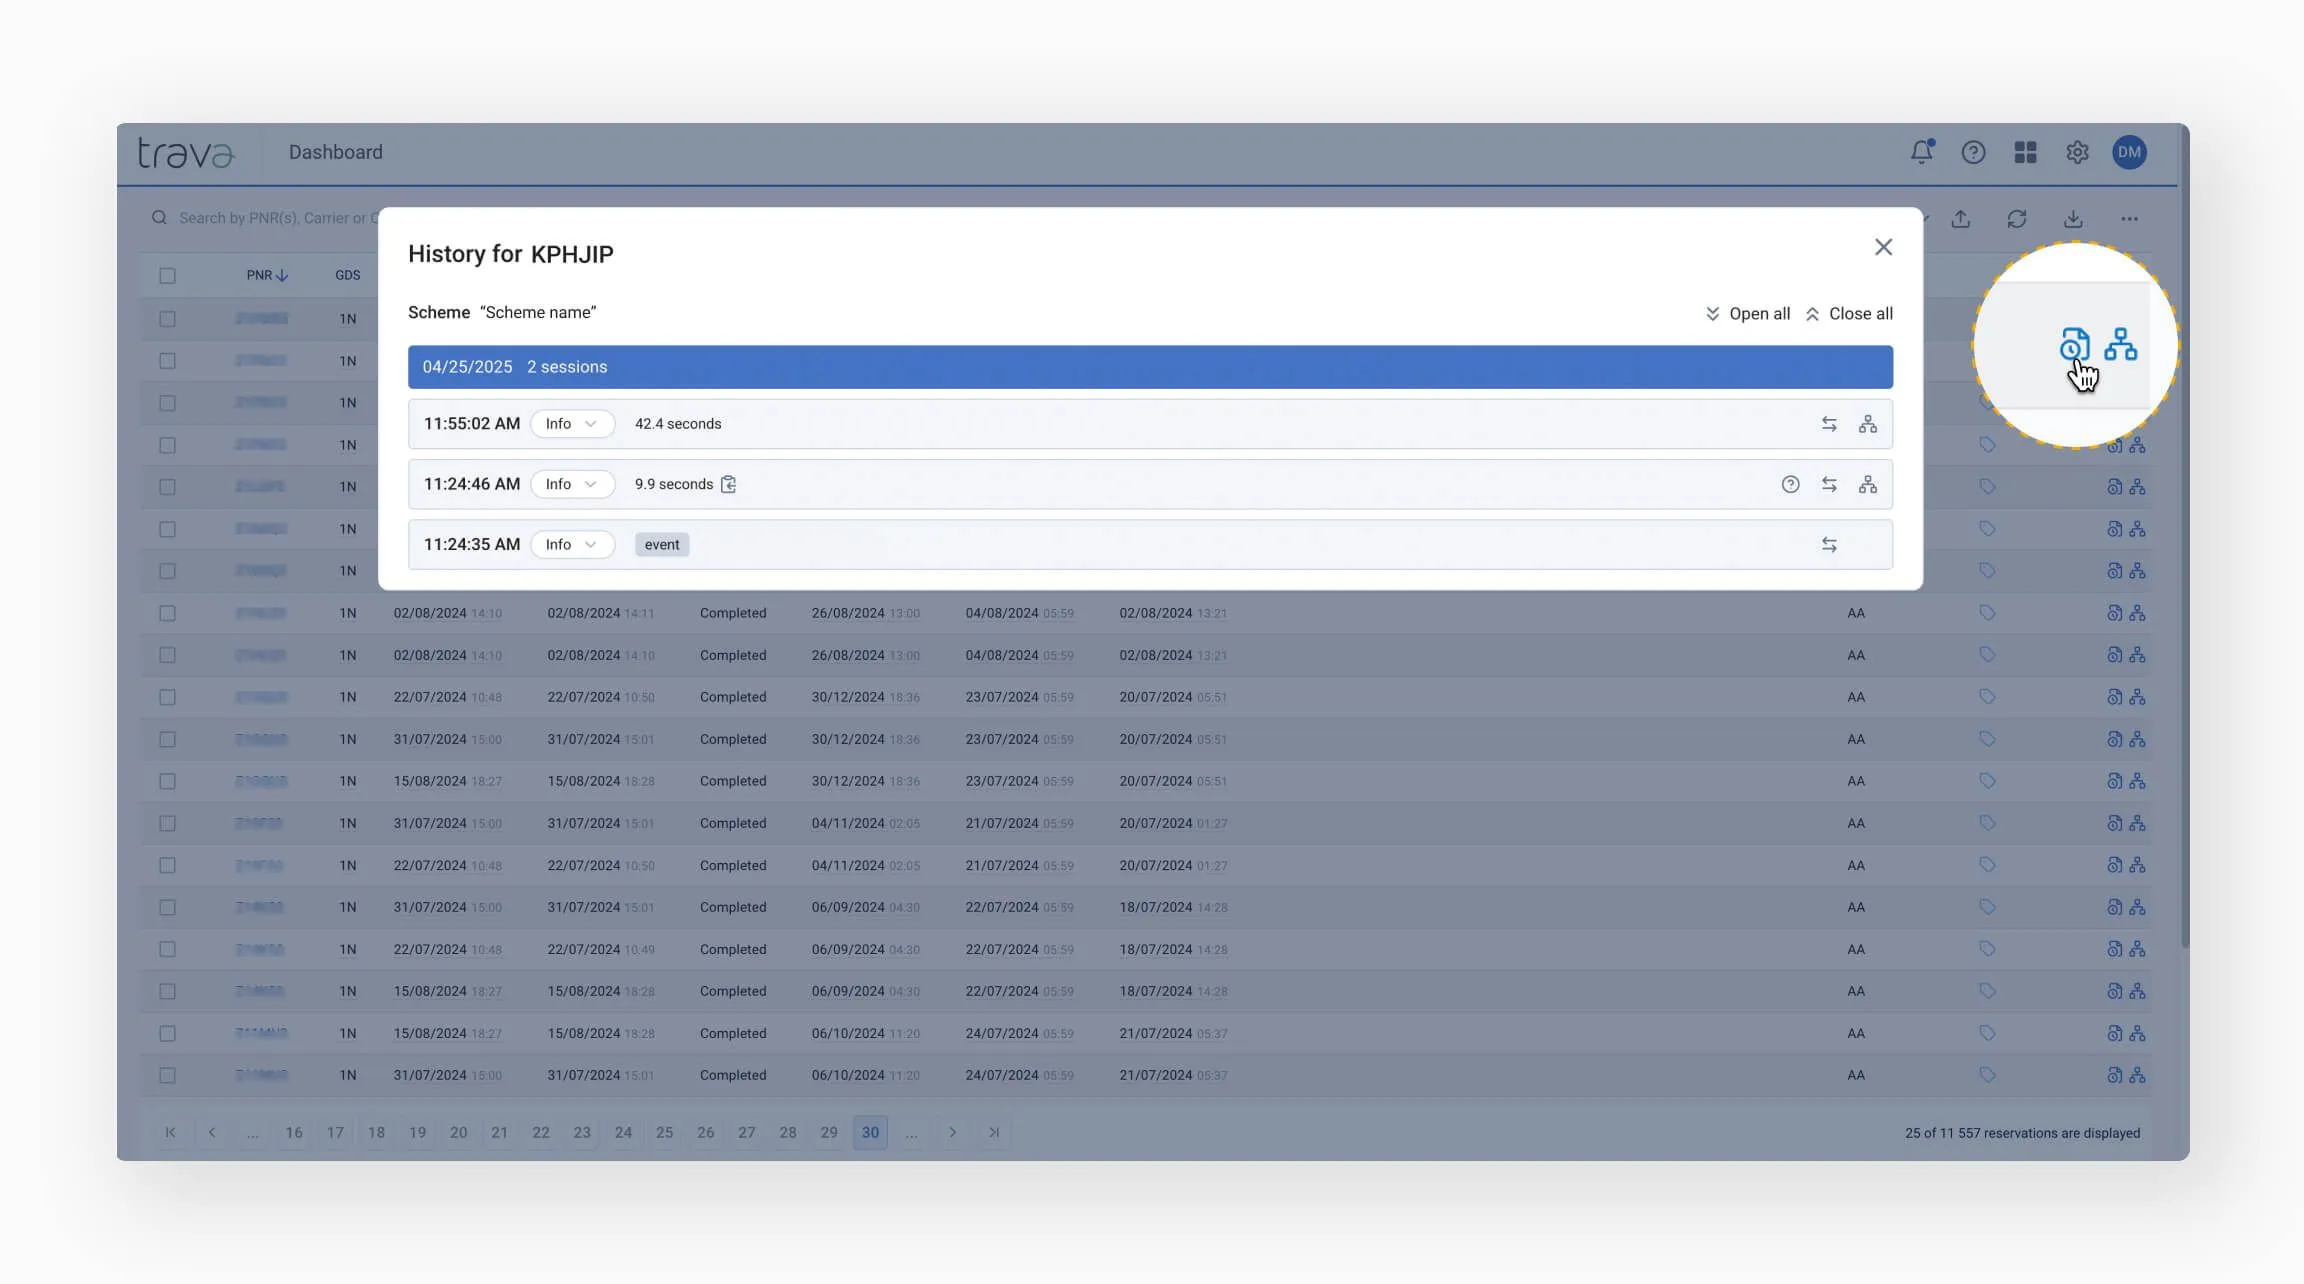
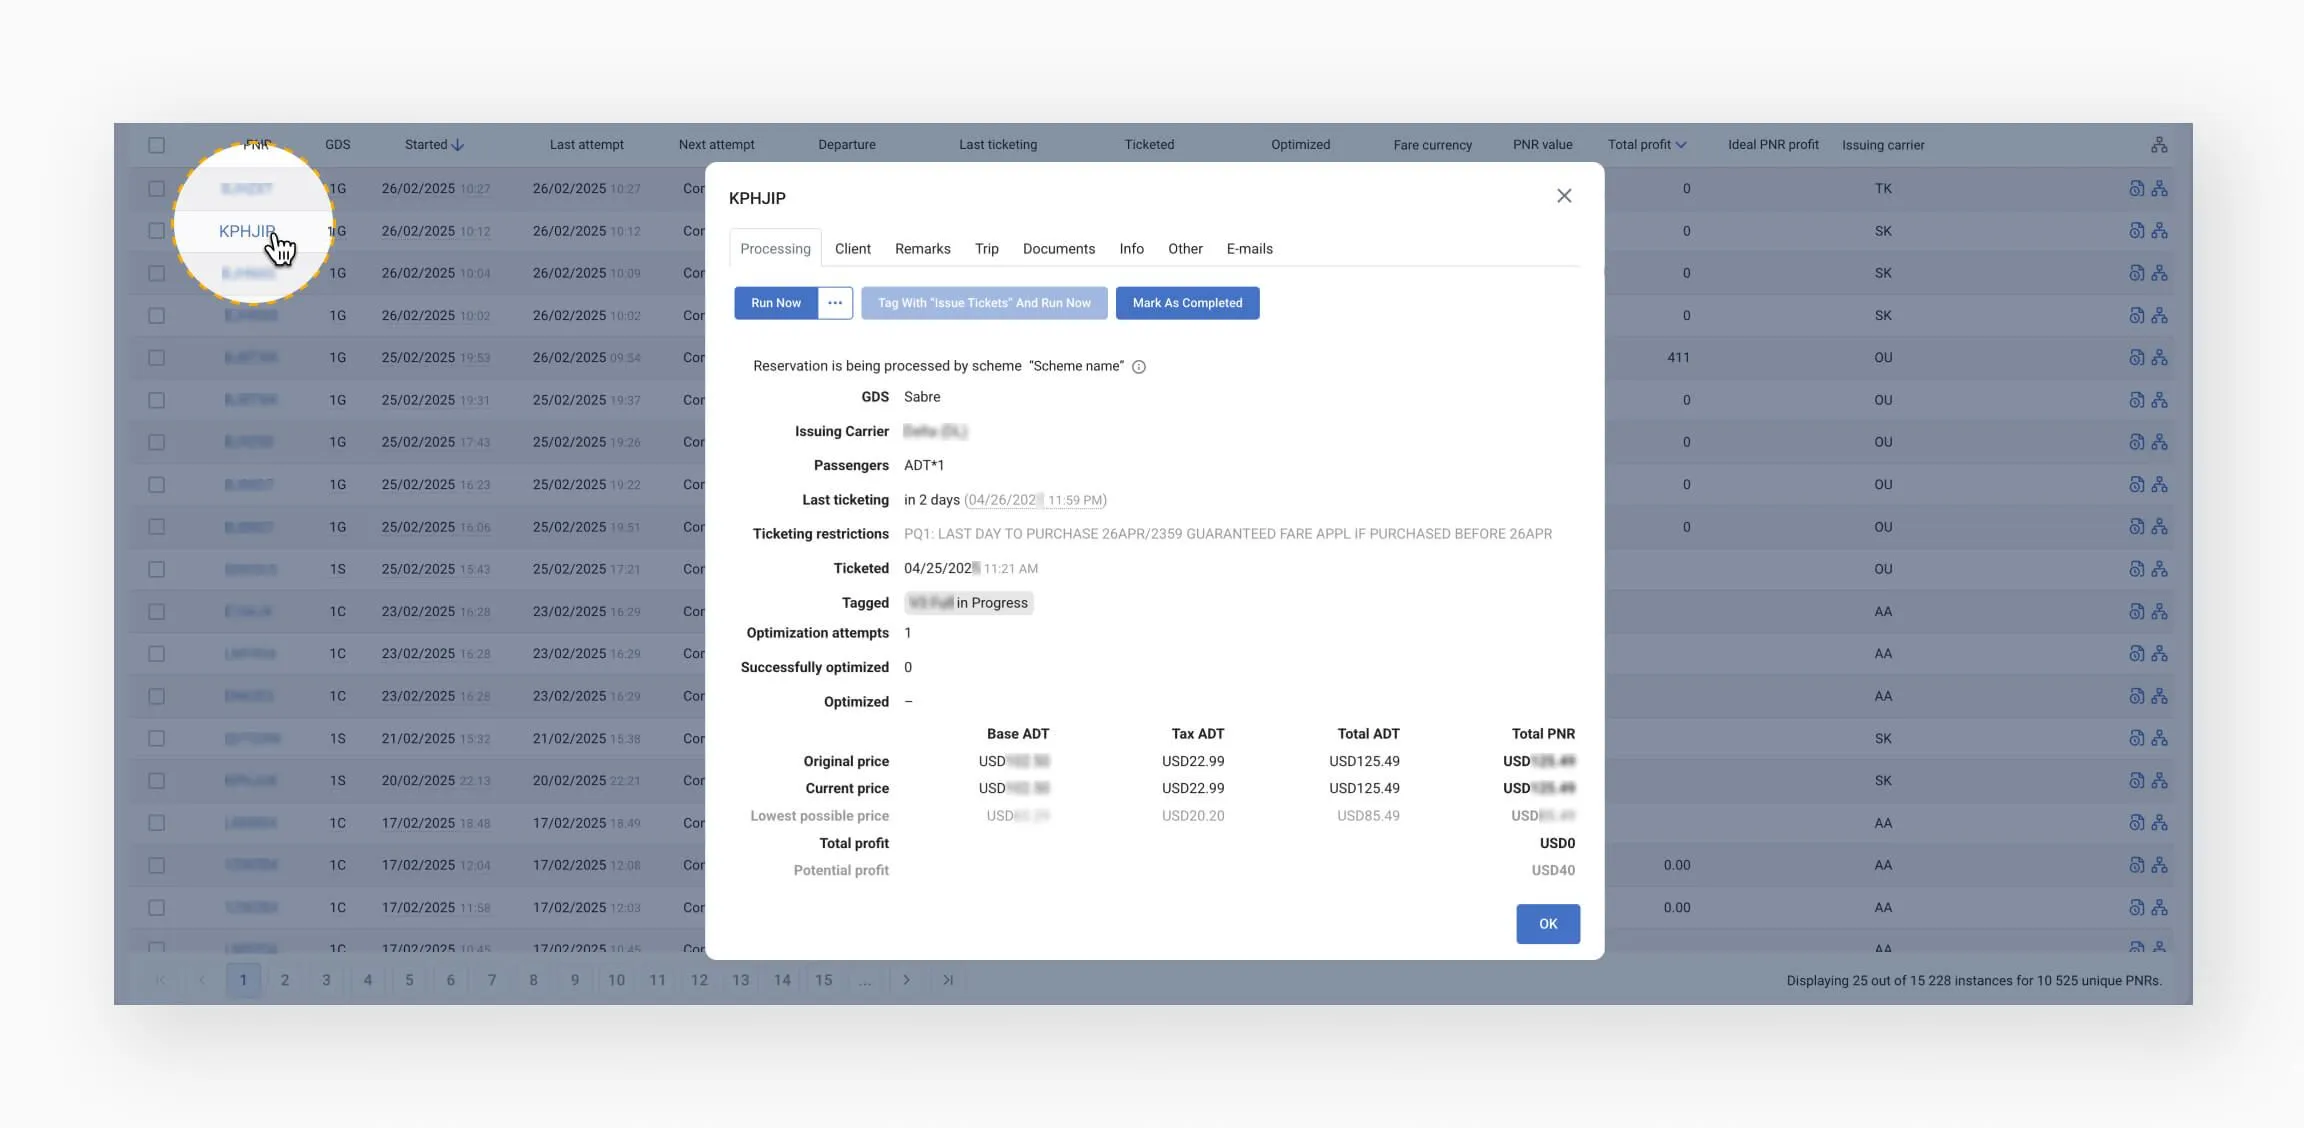
This section provides a detailed overview of the information displayed in the modal window, as well as the actions you can perform on a PNR directly from the screen.
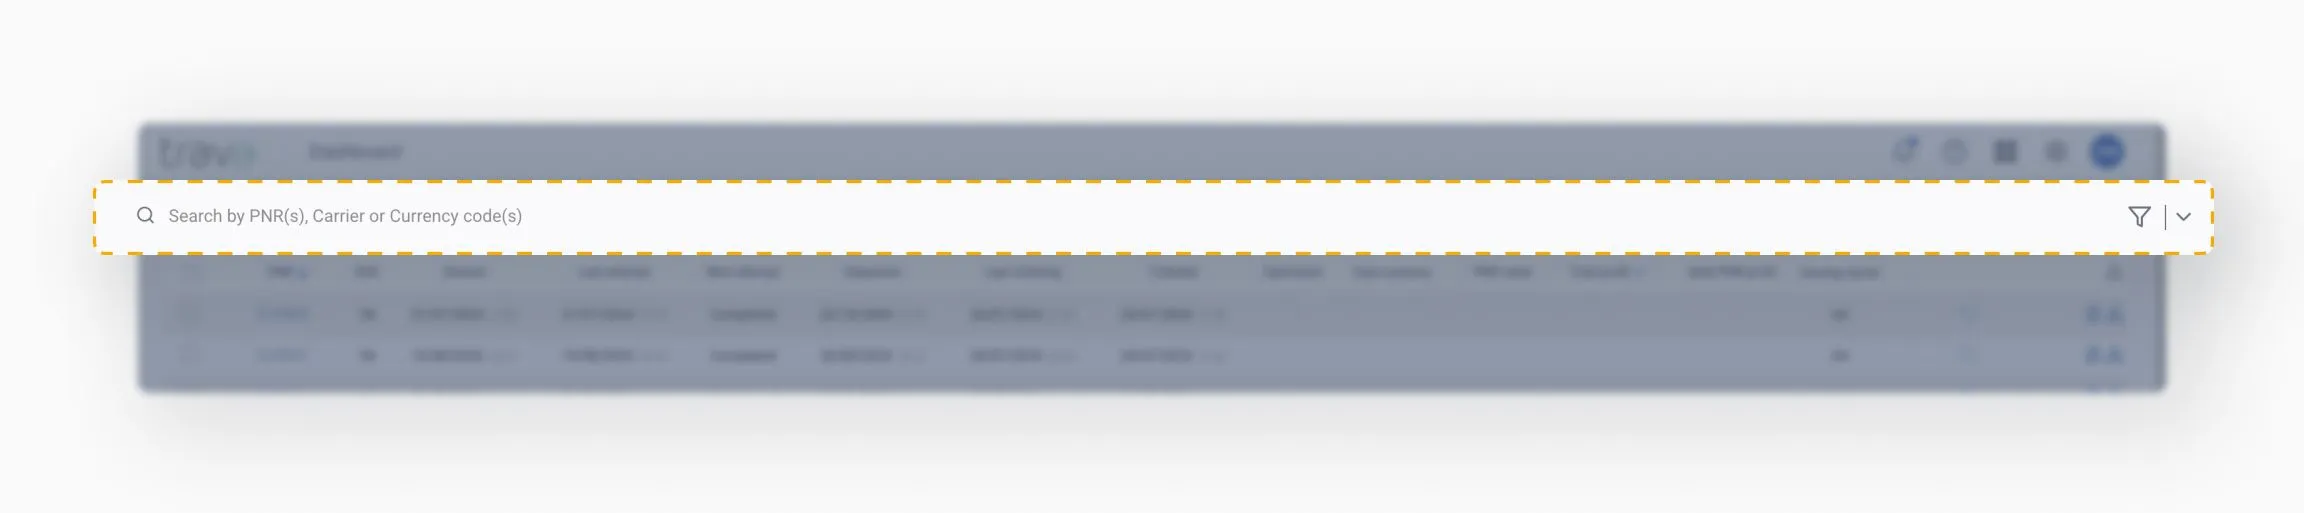
An overview of the functionality available in the top panel icons. You’ll get familiar with search and filter options, exporting data to Excel reports, and personalizing the display of the Reservation Processing page.
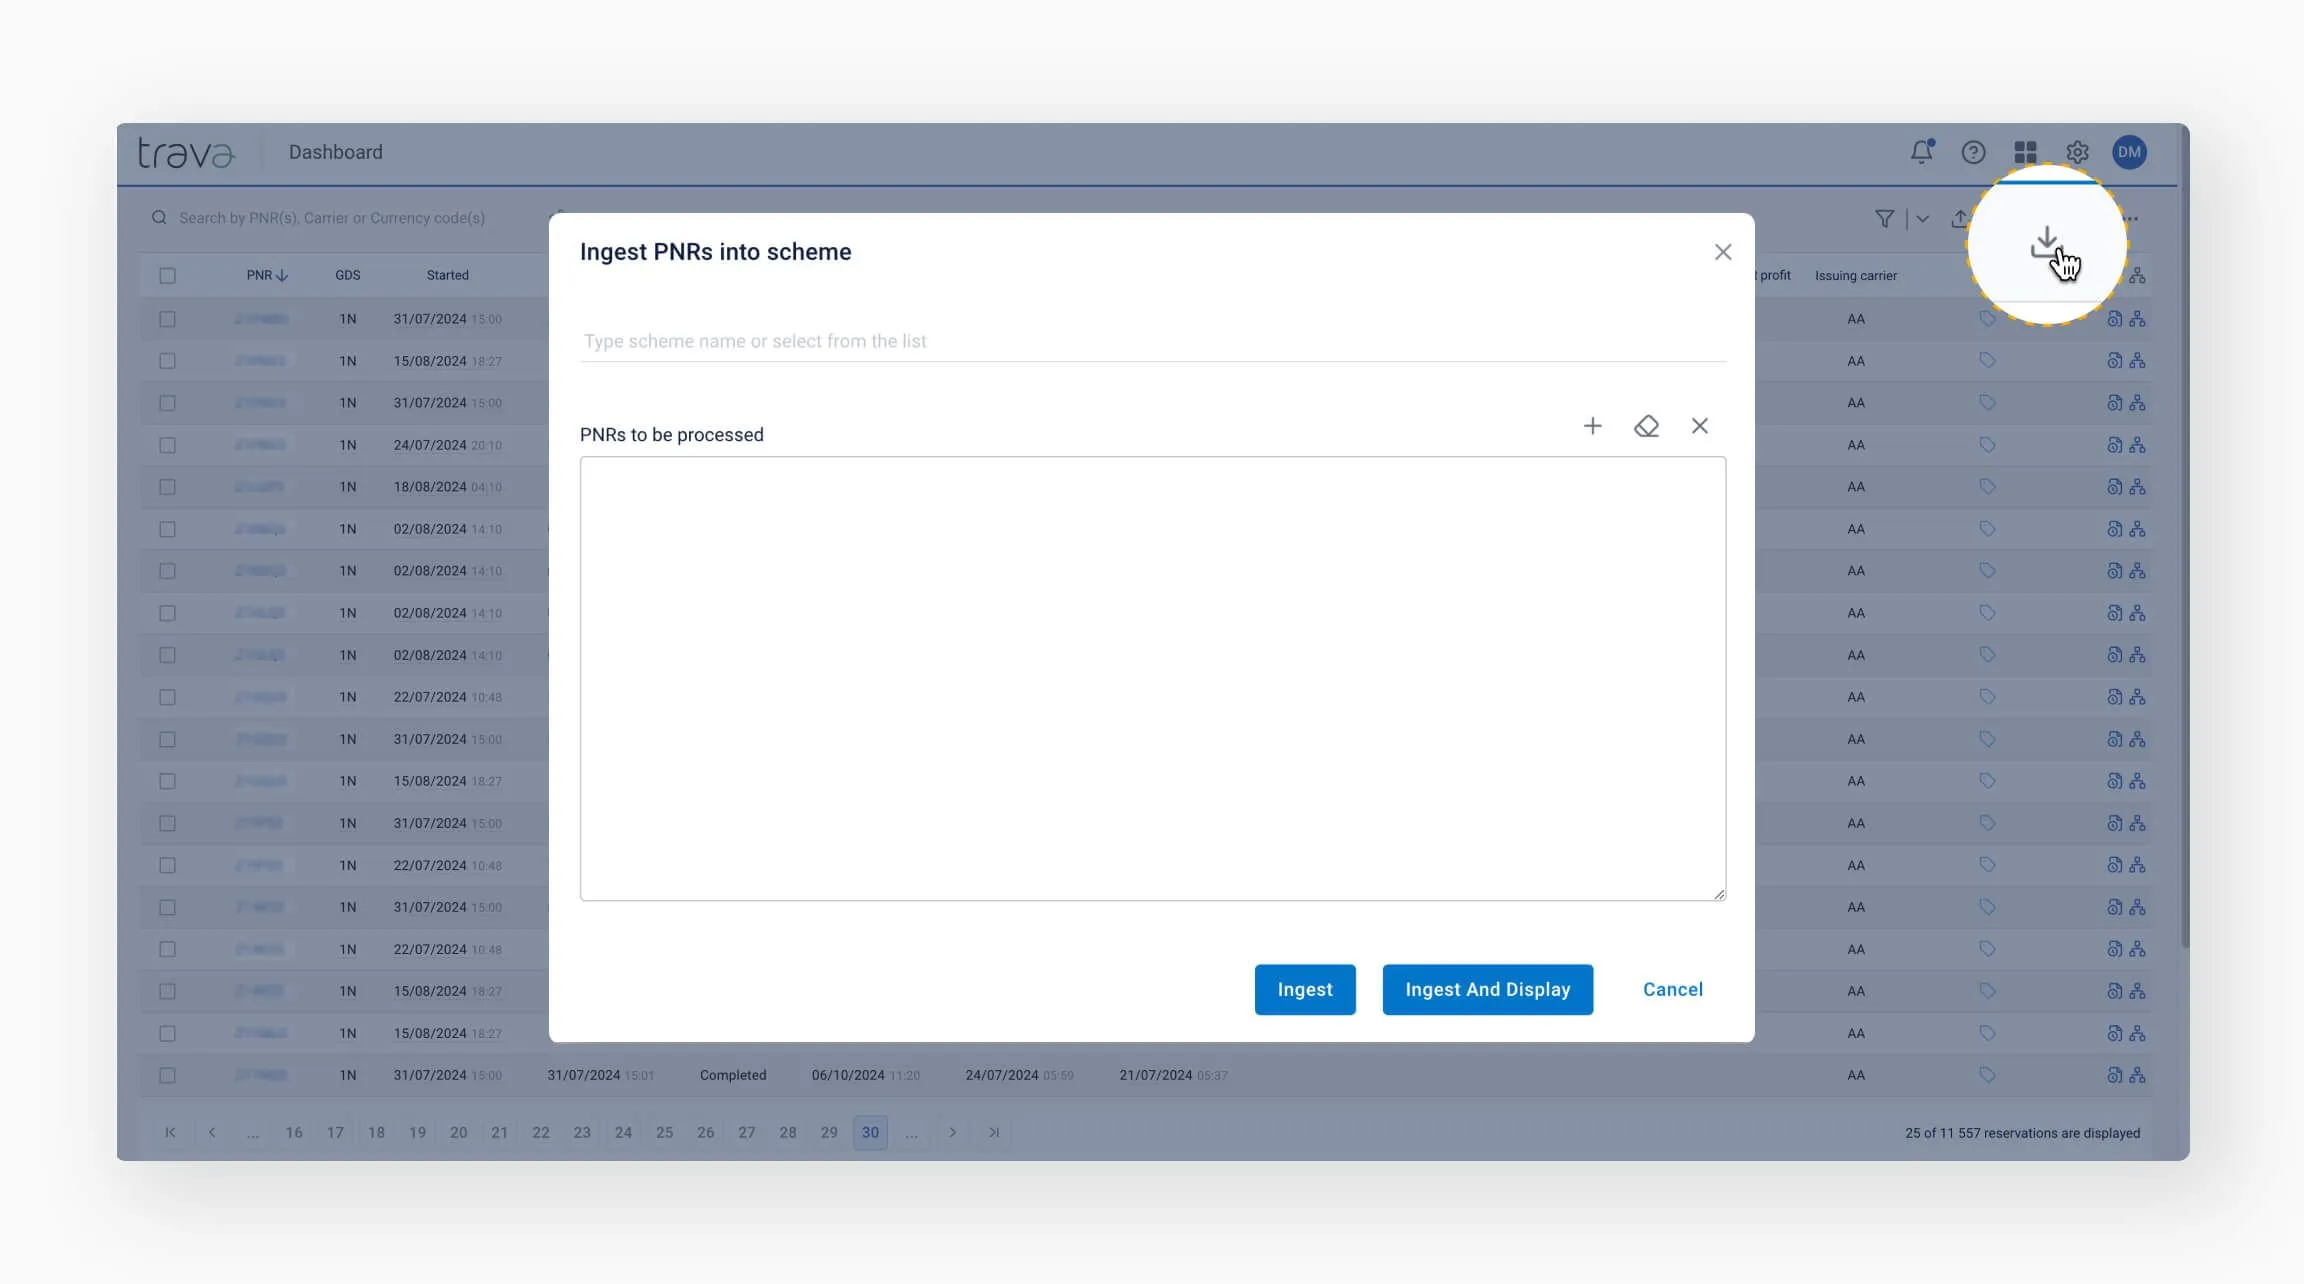
Here, you'll learn how to manually run PNR for a new or existing instance, as well as what actions become available when one or more PNRs are selected.
This section provides information on how each PNR was processed by the scheme. These insights help you analyze scheme performance in practice, assess its efficiency, and make informed decisions about workflow optimization or adjustments.